| Sex | BW |
|---|---|
| F | 2.15 |
| M | 2.55 |
| F | 2.95 |
| F | 2.70 |
| M | 2.20 |
| F | 1.85 |
| M | 2.55 |
| M | 2.60 |
Boxplots in Jamovi
Cheatsheet
This work was developed using resources that are available under a Creative Commons Attribution 4.0 International License, made available on the SOLES Open Educational Resources repository by the School of Life and Environmental Sciences, The University of Sydney.
1 About
The boxplot is a visual representation of a dataset’s distribution, showing the median, quartiles, and outliers. It is useful for comparing distributions between groups and identifying outliers within a single group.
Assumed knowledge
- You have Jamovi installed ideally 2.5.7.0 or later.
- You can follow instructions to select, click and drag elements in Jamovi.
Data structure
The data should be in a long format (also known as tidy data), where each row is an observation and each column is a variable (Figure 1). If your data is not already structured this way, reshape it manually in a spreadsheet program or in R using the pivot_longer() function from the tidyr package.
| F | M |
|---|---|
| 2.15 | 2.55 |
| 2.95 | 2.20 |
| 2.70 | 2.55 |
| 1.85 | 2.60 |
2 Data
For this cheatsheet we will use part of the possums dataset used in BIOL2022 labs.
3 Import data
- Click on the Menu icon:

- Select Open > Browse, and navigate to the downloaded file.
- Click Open to load the data.
4 Plot
- Click on the Analyses tab.
- Select Exploration > Descriptives.
- Add
Sexto the “Split by” box. - Add
BWto the “Variables” box. - In the “Plots” tab, select Boxplot.
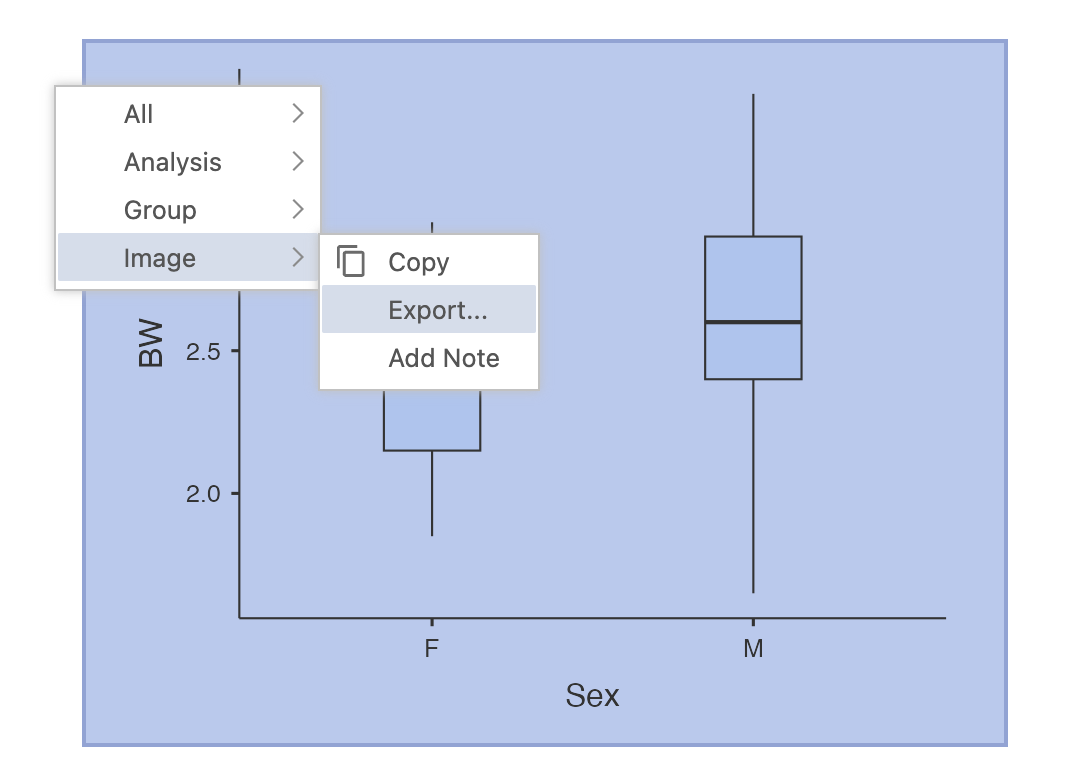
5 Export
To export the plot, right click on the plot, select Image > Export… > Browse and rename the file before clicking on the Save button.