Scatterplot in SPSS
Cheatsheet
About
The boxplot is a visual representation of a dataset’s distribution, showing the median, quartiles, and outliers. It is useful for comparing distributions between groups and identifying outliers within a single group.
- You have SPSS installed, ideally version 28.0 or later.
- You can follow instructions to select, click and drag elements in SPSS.
Your data should be structured in a way that makes it easy to plot. The ideal structure is long, i.e. one where each column represents a variable and each row an observation (Figure 1). You can either reshape your data in R or move cells manually in a spreadsheet program to achieve the desired structure. For boxplots comparing more than one group of data, a categorical variable representing the group should be present in the data.
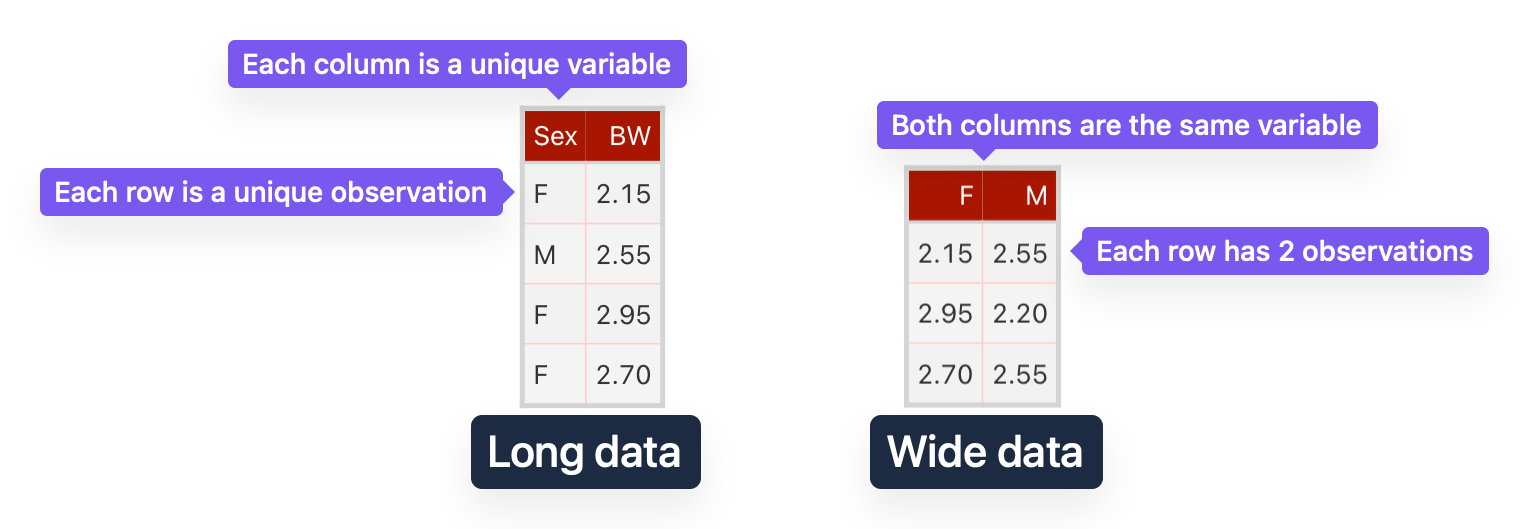
Sex is categorical and BW is the measured, continuous response – is preferred over wide data (right), as it makes it easier to manipulate data when plotting.
Data
For this cheatsheet we will use part of the possums dataset used in BIOL2022 labs.
Import data
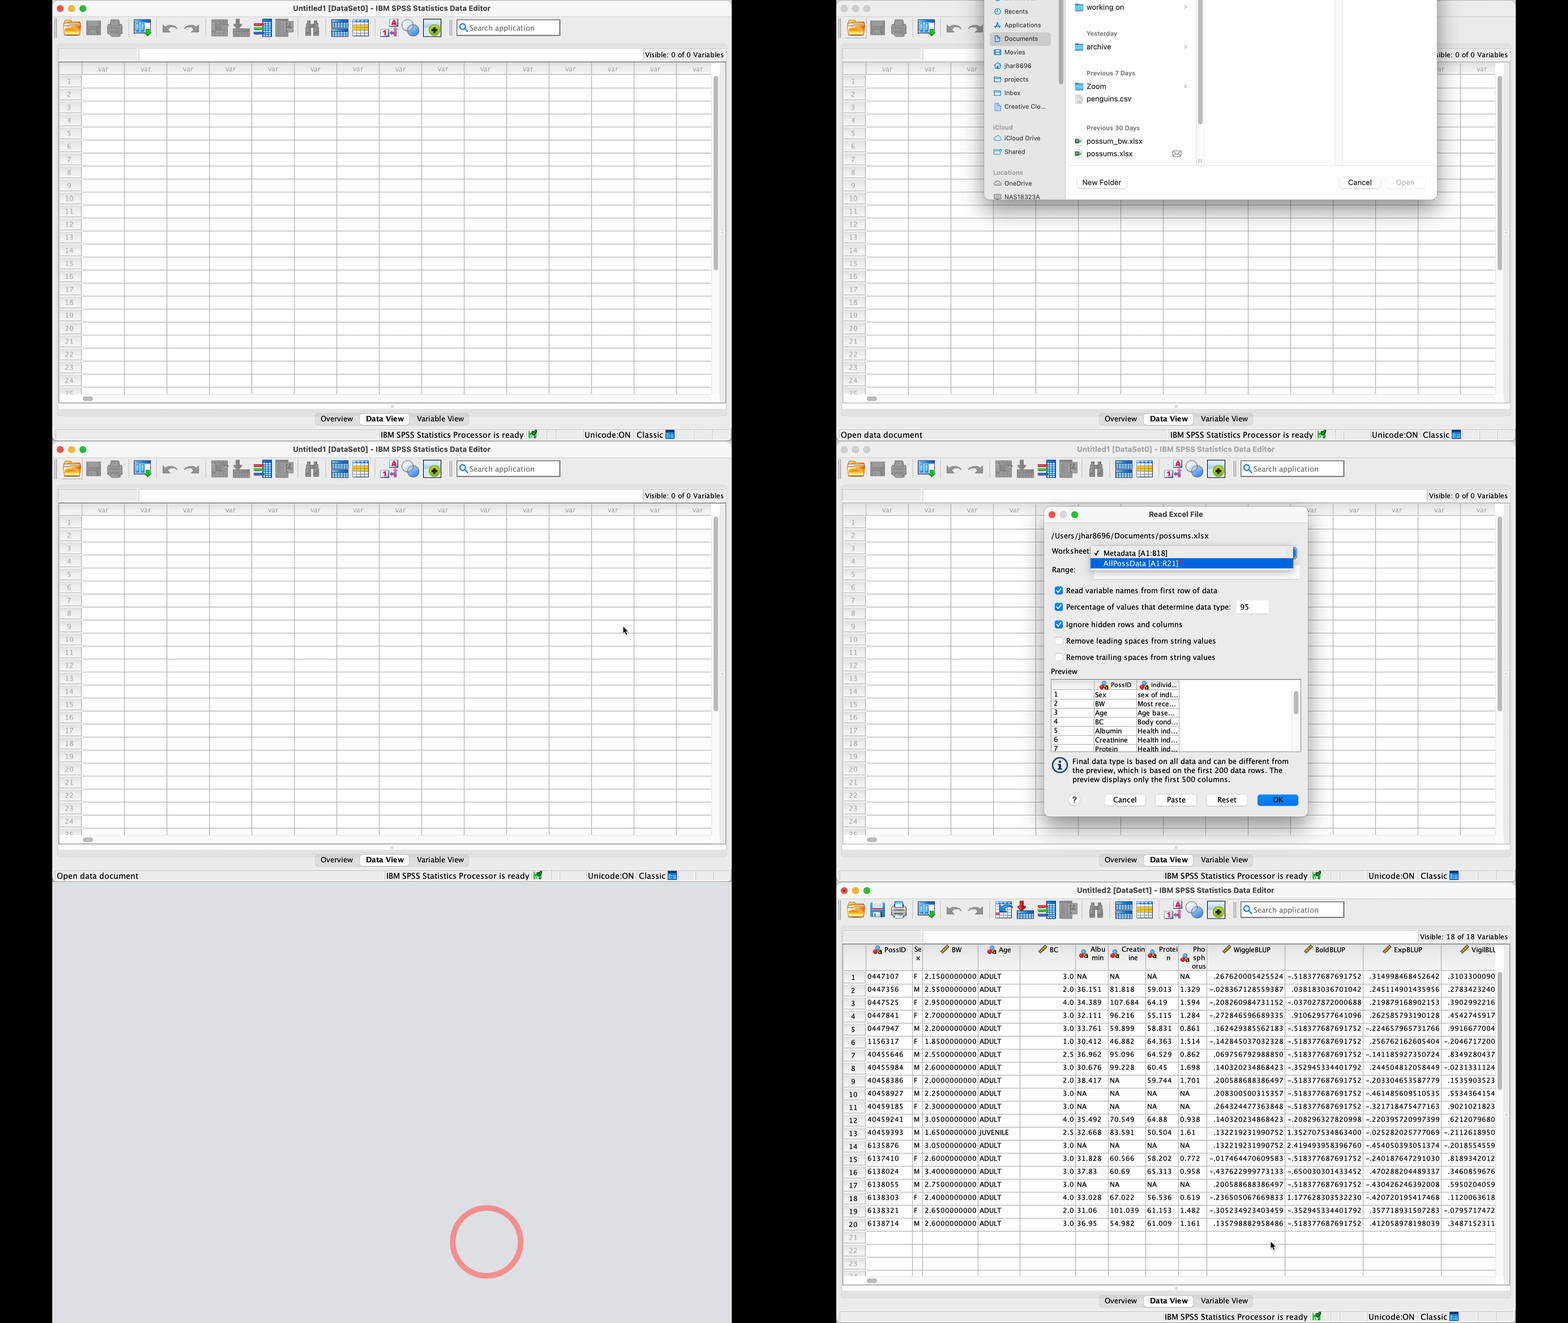
Open SPSS and import the data file:
File>Open>Data...- Select the downloaded file
possums.xlsx - If there are multiple sheets, select the one with the data in the Worksheet dropdown
- Check that the data is correctly identified and click
OK
Plot
- Go to
Graphs>Chart Builder...- If a warning box appears on “measurement level”, click
OK(should be safe to ignore and you can fix issues later).
- If a warning box appears on “measurement level”, click
- Select boxplot from the gallery at the bottom of the window.
- Drag the boxplot icon to the canvas.
- Drag one continuous variable to the
X-Axisbox. - Drag one continuous variable to the
Y-Axisbox. - Check the “Total” bpx in “Linear Fit Lines” to add a regression line to the plot.
- Click
OKto generate the plot.
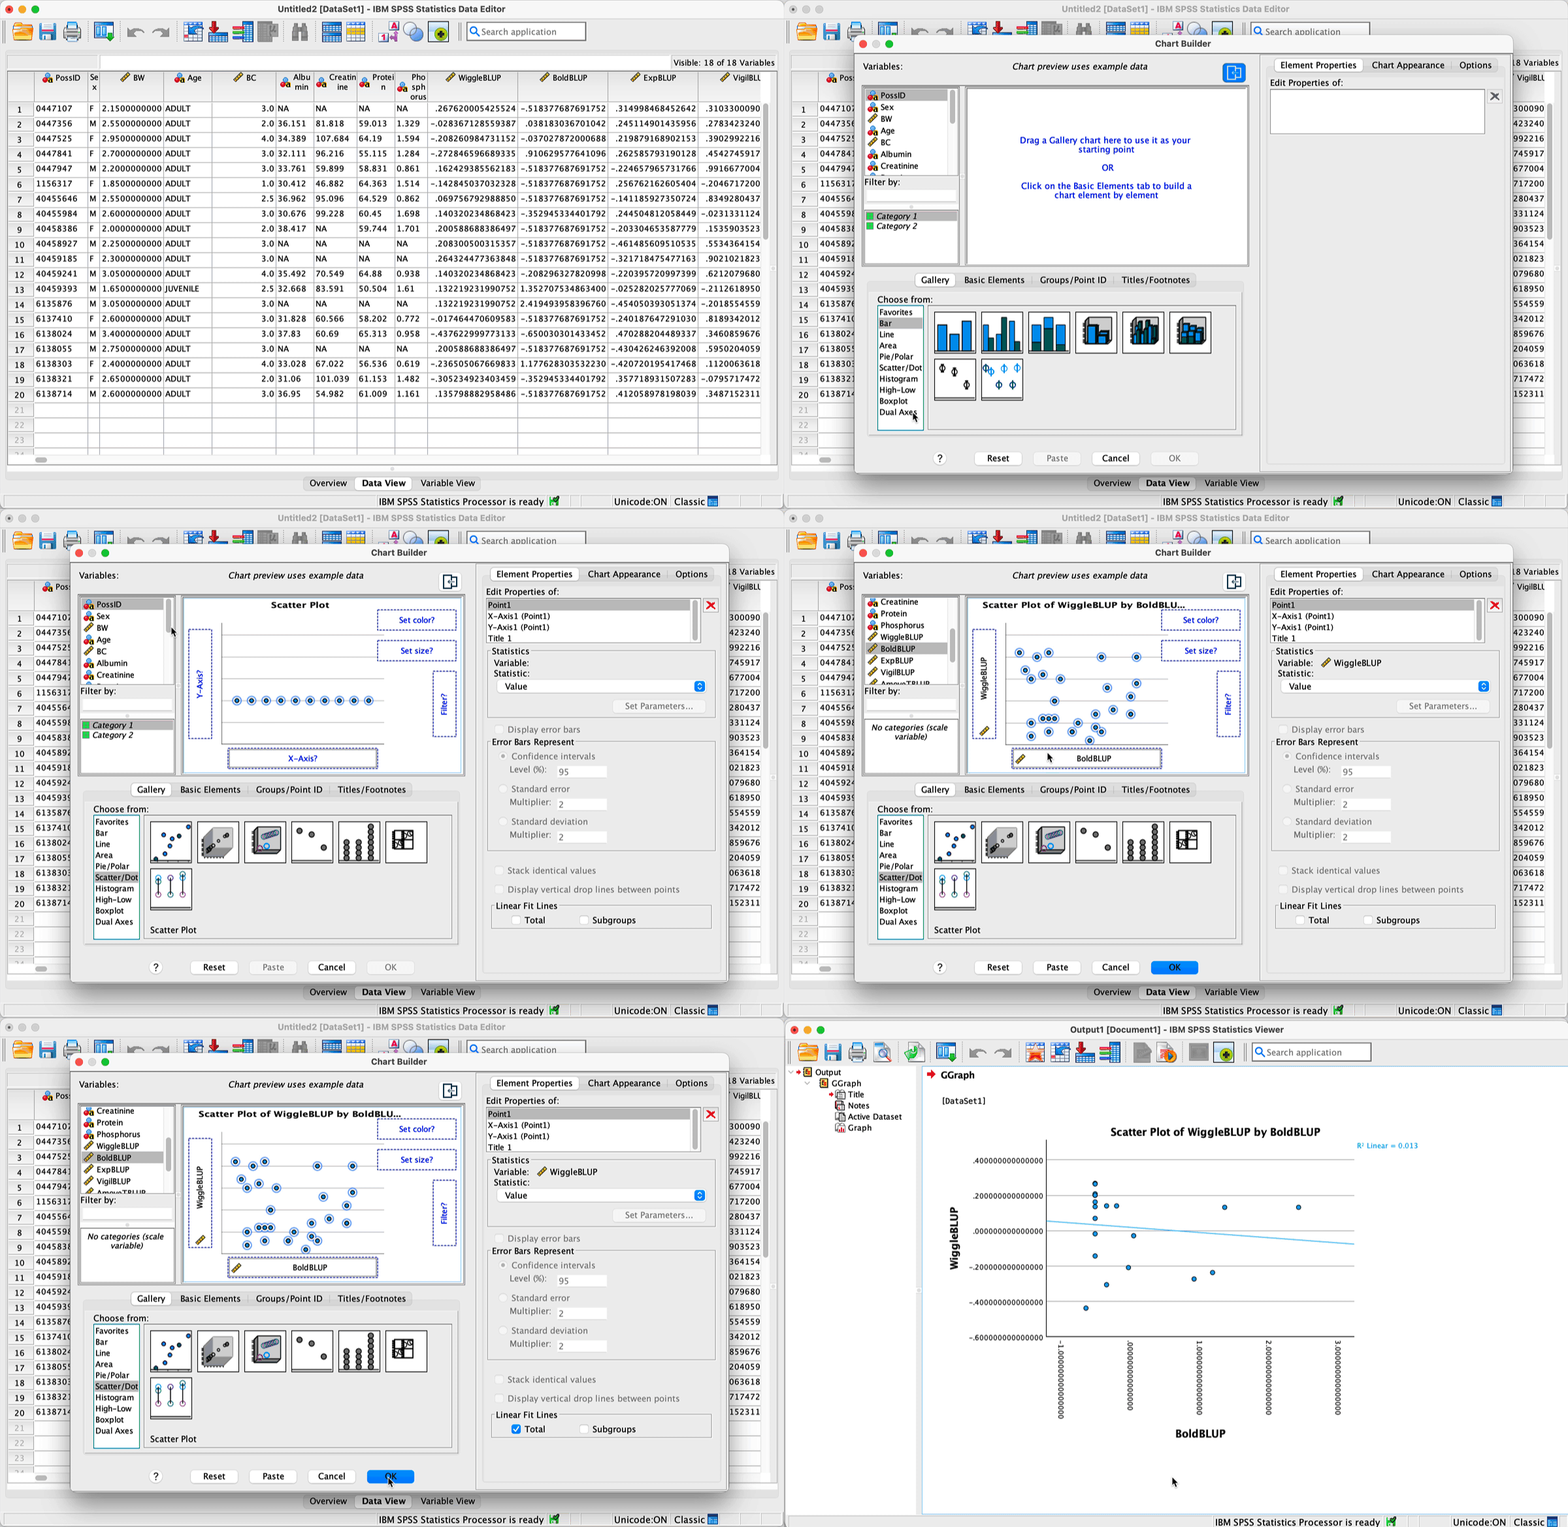
Chart Editor
To make changes to the plot, double-click on the plot to open the Chart Editor. Play around with the options to customise your plot.
More resources
- Scatterplots and dot plots by IBM SPSS – official documentation.
- A Simple Scatterplot using SPSS Statistics by Laerd Statistics – a tutorial on creating scatterplots in SPSS with details on customisation.
- SPSS Scatterplot Tutorial by SPSS Tutorials – another tutorial, this time also covering syntax (code).
License
This work was developed using resources that are available under a Creative Commons Attribution 4.0 International License, made available on the SOLES Open Educational Resources repository by the School of Life and Environmental Sciences, The University of Sydney.